Following on from our successful conference last month, News Networks is busy once again, this time in producing a two-volume edition that aims to re-evaluate the history of news in Europe. The aim of the project overall could be summarised as forging its own network in order to link and so affect scholars working in the field, discussing shared problems and different methods in order to come up with genuinely new approaches and cast light on the old.
One of the minor difficulties involved in writing about the News network project has been the proliferation of the word network. We’re a scholarly network looking at early modern news networks, with some using the ideas of network theory and some the technology of network analysis to make sense of them. This is not just a stylistic coincidence, and it’s provoked me to reflect a little on the importance of the term network in the constitution of our scholarly collaboration, our subject, our method of approaching it, and the tools we have for analysing it.
Approaches
Instead of recapping forty papers from the conference (for a snappier, more organic review see our Storify) or detailing the volumes, I wanted to offer some personal reflections on methods and approaches that have featured in both. The volumes themselves speak to a division and its potential problems: the first is roughly methodological and the second focused on case studies. When dealing with essays of 8000 words or so this isn’t always a straightforward distinction, which makes me think of a discussion that has arisen a few times in the project’s life: the relationship between the ‘big picture’, the isolated case study, and computer analysis.
Some questions come to mind. What are our options when wanting to find out about any given subject? Is there anything between the grand narrative and the detailed case study? Is the point of the latter to help find the former, or should it stand alone, better reflecting the complex and irreducible nature of the ‘big picture’? Further, what do we mean by ‘big picture’; do we mean something fundamentally simply or fundamentally complex, or does this depend on whether we think we can capture it?
When computers and the so-called digital humanities come in, we’re confronted with a similar choice: do we want to focus in on the detail, the story, or have big data show us overarching themes, maps and networks? During the conference, it was pointed out that to think of these as oppositional is misleading; they can be complementary.
Taking the first pairing, perhaps they are not as remote from one another as first thought : the case study contains and contributes to wider narratives, and the wider narratives carry exemplars and the sometimes invisible support of myriad smaller details that can be excavated at will. I would say that the same can be said of computer analysis: it is not alien to the narrative case study, it is just one of several tools that contribute to writing history. We can use data analysis as well as narrative writing to uncover key trends, to build a case study, or to do both at once.
Likewise, digital possibilities should not be posited as the saviour of truth in history; there won’t be a computer programme that we can put all our collective data into and churn out the exact picture of the past, because it is not lying there waiting to be discovered. But it would churn out something new, new angles and a new approach, or promote for further study aspects that previously had seemed marginal, or had been hidden entirely.
Networks
It struck me that there are several things one could be talking about when using the term ‘network’ in relation to this or any other project. Firstly, there’s the group itself, the network of scholars that we’ve created. Then there are the networks we’re studying, the early modern connections that facilitated the transfer of news, thinking about postal routes and social groups (political, mercantile, confessional and so on). This, when considered in terms of network theory, divides again: we can think about these early modern networks in light of the ideas of network theory, so applying to them what we know about modern social networks (their non-random nature and tendency to cluster, the importance of hubs, that there are factors other than distance that influence the shortest routes across the network) and/or we can conduct network analysis on our historical data , like Ruth Ahnert’s impressive data analysis and visualisation of an underground network of Protestant correspondents.
So, you don’t need a computer science degree to get networks: you can start thinking in terms of them without doing computer analysis. A popular introductory text is Linked: The New Science of Networks, by Albert-laszlo Barabasi, and Franco Moretti’s Distant Reading and Matt Jockers’ Macroanalysis also have relevant chapters (with thanks to Ruth for the recommendations).
To start exploring data you need two things: the data itself (in a useful and valid format) and questions you want answers to. Exploring pivot tables in Excel is a good start for getting used to manipulating data, and seeing how it responds as and when you change your terms. Then there’s a variety of data analysis and data visualisation open source software, including Gephi and OpenProcessing (there are also massive corporate tools, for example Palantir, used a lot in law enforcement, and i2 Analyst Notebook, as used in the TV series The Wire).
One interesting DH project on the horizon will make use of the Centre for Editing Lives and Letters’ Correspondence of Thomas Bodley digital edition: Joined Up Early Modern Diplomacy. Dr Robyn Adams is starting the second phase of research on a database of letters to and from Bodley, the first phase of which involved myself as research assistant and Dr Adams as editor transcribing and putting online over a thousand of his letters. I’m going to end this blog post with a few thoughts on this data.
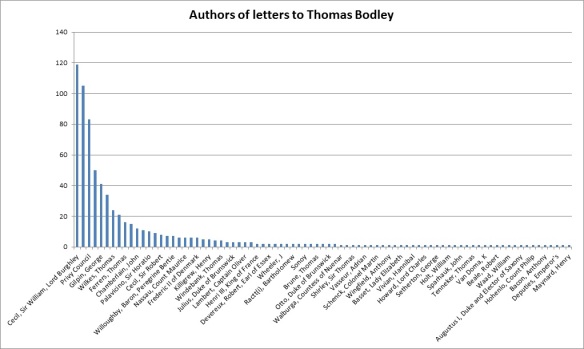
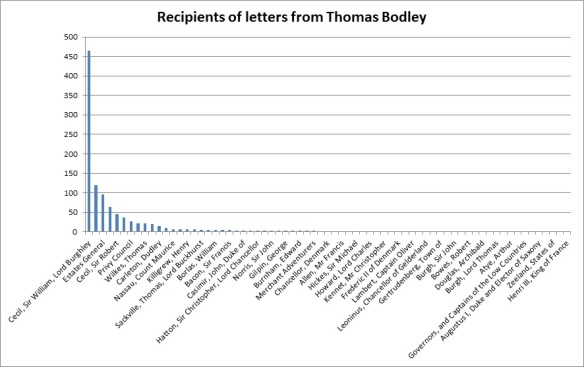
Exploring the data in the aforementioned excel pivot tables allows you to quickly and easily summarise specifics. For example, using this I can create a couple of charts that show how many letters Bodley received from each of his contacts, and how many he sent.
Interestingly, these appear to follow something called a power law distribution, where there are a few massively key players, which decays to many more contacts who play much smaller roles. This is as opposed to a bell curve, for example, which indicates that what’s being measured is random, with a common middle range, such as people’s height or IQ – there is a norm. A power law distribution is an indicator that the group is not random. It is what we see when we look at social networks, and can also be understood in terms of the perhaps better known 80/20 rule. This is a phenomenon that crops up repeatedly in the social, natural and economic world: that 20% of activity tends to result in 80% of the outcome. The figures for the Bodley letters seem to behave similarly: 18% of writers to Bodley account for 80.2% of the letters he received.
In social networks, these important people are hubs – those who are connected to much more people than most, and help facilitate interaction across the whole network. It seems that there are always some people who are hugely more influential and well-connected than others, and they don’t just have to be those at the top of the social or political tree, either.
Whilst it’s gratifying that the graph reproduces something we would expect, and essentially that we already know, it’s only the tip of the iceberg. The next phase of the project is to represent some of the data visually, to ask it new questions and raise new points of interest by presenting the information in new ways. Perhaps the project will come up with a time-delay animation of the people and places Bodley writes to, showing the changing relationships and importance of different hubs on the political scene. Perhaps it can track the movements of the bearers of letters across the geographical and social landscape.
To come back to the earlier point about case studies and wider pictures, the Bodley correspondence is limited by what defines it: it is the correspondence surrounding one man, and so begins as a partial network. Can its specificity be a positive, though? Its criteria mean that it has boundaries, and so can be held in one place and looked at from all angles. Perhaps, just as in a power law distribution, there is no norm in the relationship between big picture and specific case study, and so we cannot take them as representative of the whole. But perhaps that is the wrong way to think of it: the whole is a complex set of constantly moving relationships and processes, and each case study, analysis and narrative recovers one version of what went before.
Elizabeth Williamson


Reblogged this on Early Modern Post and commented:
Re-blogging (?) of a piece I wrote for the News Networks in Early Modern Europe project.